
Back-of-the-Napkin Business Model Math
(Or how to know: “If I don’t do it, someone else will!”)
I have the privilege of working with entrepreneurs and technologists every day. The optimism and excitement of figuring out technology businesses is infectious and it’s why I get out of bed in the morning.
That same optimism often prevents founders from communicating why their business makes sense from first principles, because it’s so obvious to them that it should exist. In my experience, the ability to think through and communicate why a business needs to exist at the very earliest stages is a massive indicator of future success.
Another way to frame this is simply: “What must be true in order for my business to make sense?”
My goals with this guide are:
Provide a tool to identify key assumptions driving if your business is viable
How to validate your assumptions
Do both of these FAST without overthinking
Examples - Production outages at oil and gas facilities
In this guide, I’ve used an anonymous example of how I’ve done this type of modeling for my own businesses to illustrate just how simple this really is.
To understand the example, all you need to know is that these facilities are 24/7 operations. Every second they are not producing is a direct hit to the company's revenue. Maximizing operational uptime, followed by facility throughput are the key assumptions I am using to quantify the problem and value of a potential solution.
Step 1: How does your customer make money?
Quantify the high level economics of your customer’s business! This isn’t a perfect representation, it doesn’t have to be. The goal is to understand the scale of the operations.
Below is an example of how I would model out an oil production facility in Alberta based on publicly available data.
Oil Production Facility Economics
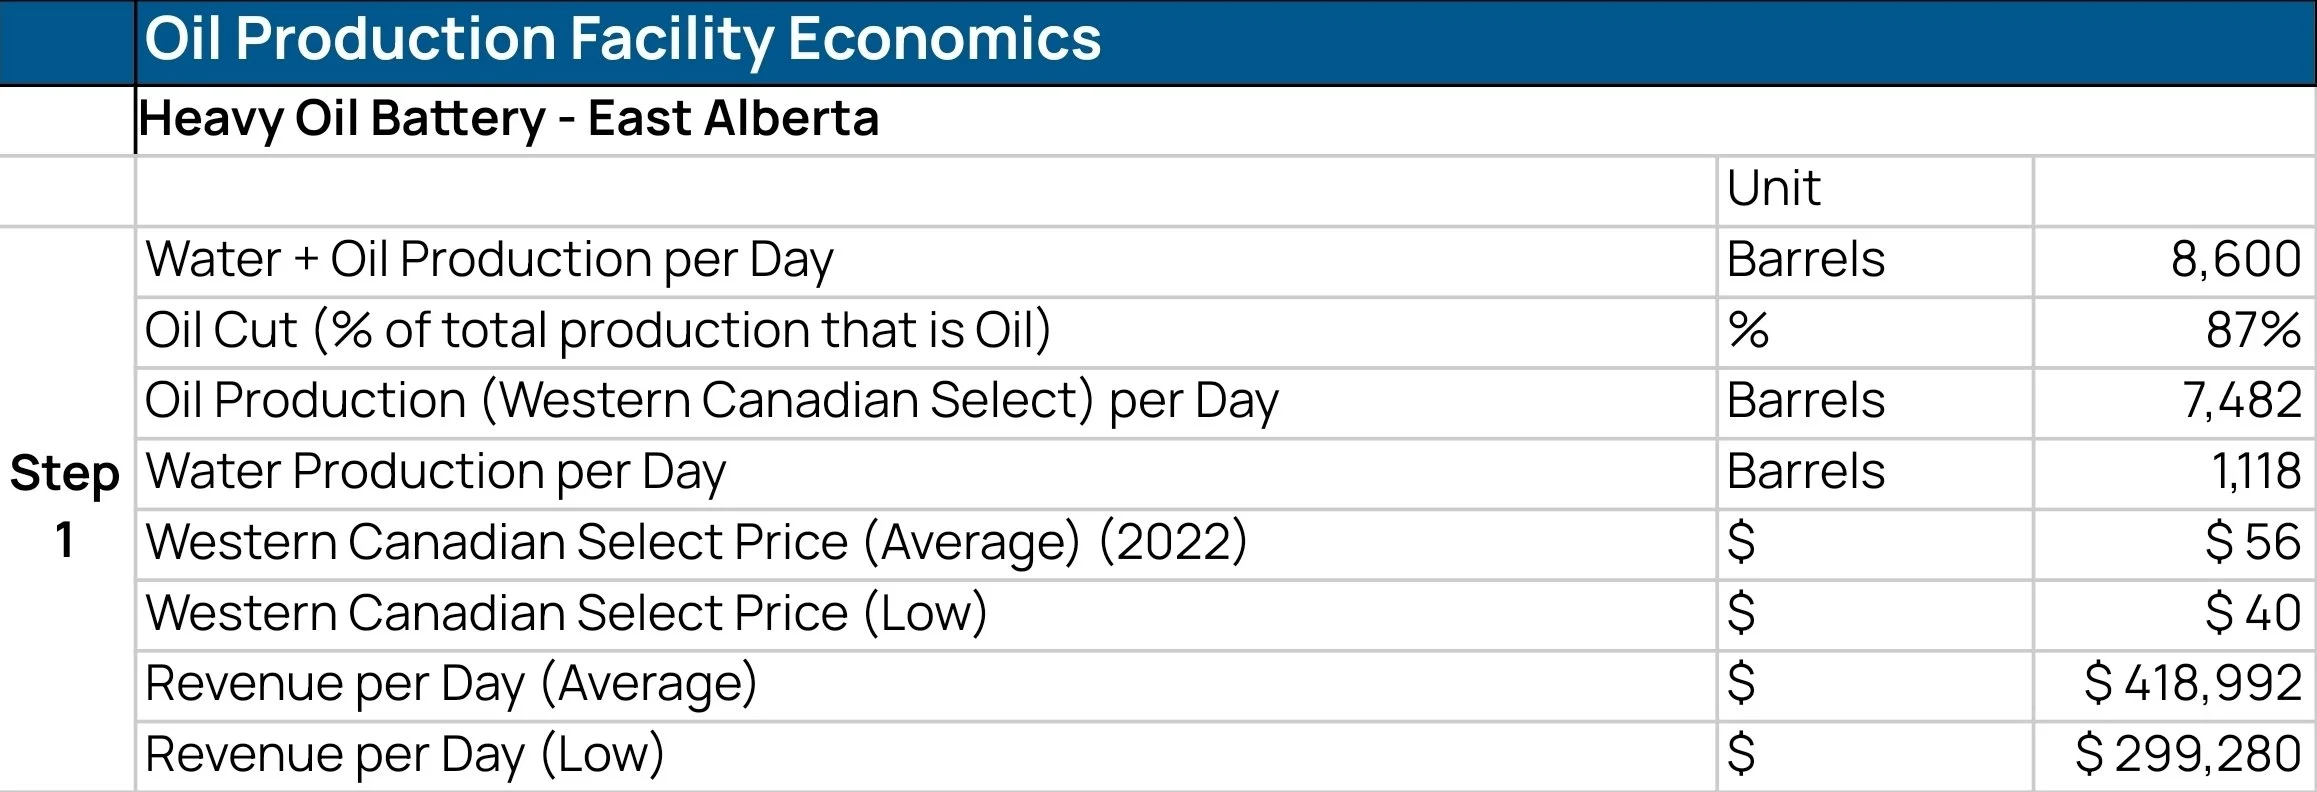
With this model, we can estimate the daily revenue of this facility is between $300k-425K, or annual revenues of $100-150M.
Step 2: What is the size of the problem?
We need to quantify how your customer is losing money today in dollars and cents, and identify the parameters that drive the size of the problem.
Nobody will believe you when they hear “we can be cheaper” or “we are going to save you time” without proving that you understand their business as well as they do.
We can extend the revenue model above to tease out the size of the problem. If I believe that my product can reduce the amount of time a facility is non-productive, the next step is to model out a very simple calculation of the cost of outages at the facility to understand what outages are likely costing them.
Oil Production Facility Economics
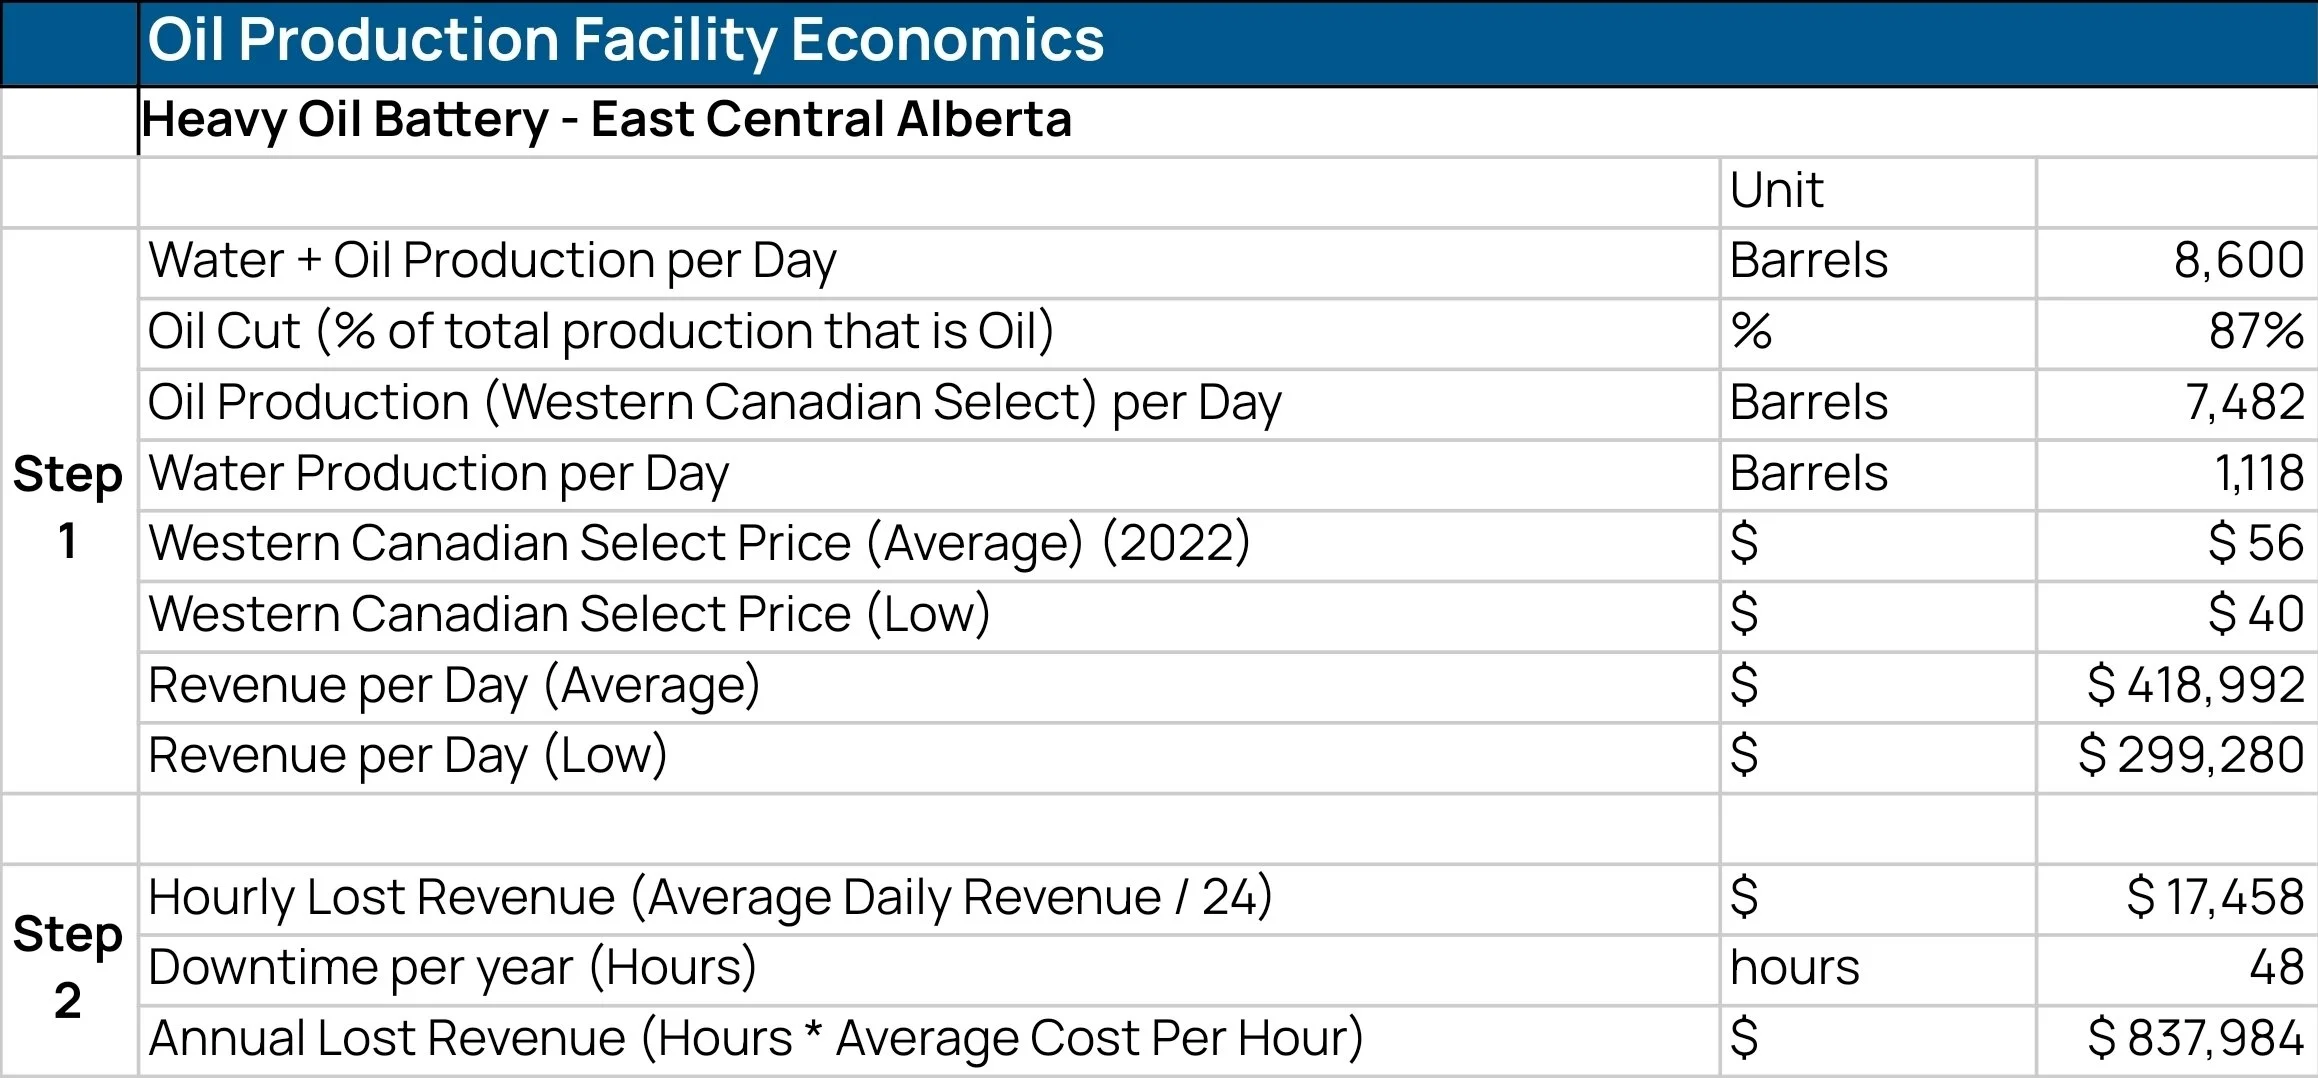
In this example, my assumption shows that the facility may be losing up to $825K per year in lost production.
Step 3: STOP! How good are the assumptions?
I’m not trying to prove that the opportunity is huge, I’m trying to prove that it isn’t tiny!
We need to start talking to customers at this point. Validating if our assumptions are in the right order of magnitude, or if we’ve missed anything significant, makes or breaks the entire business right now.
Many technologists or entrepreneurs are building solutions to the problems they already have experience with. That can be a blessing and a curse. It’s a blessing because the likelihood of making good assumptions is higher - you know your customer better than an outsider. It’s a curse because our brains like to assume we’re right, and that others think like us.
In my example, there are a few key assumptions that I want to validate, because if I’m wrong, the business opportunity doesn’t exist.
In Step 1, I have assumed a revenue range. This assumption trickles down to impact every other assumption, so a small error here is going to compound across the whole model.
In Step 2, I have assumed a frequency of production interruption. If I’m overestimating by an order of magnitude, the problem isn’t material. If I’m underestimating by the same factor, solving the problem could unlock revenue on the order of 8% of total facility revenue! ($80K, $800K, $8M).
We’ve been treating lost revenue to this point as a monolithic problem, in our customer interviews, we learned that our technology can likely only impact 75% of the outages this facility is experiencing, but we also learned that the frequency is actually about three times higher than previously thought. I’ve integrated the feedback into my model below.
Oil Production Facility Economics
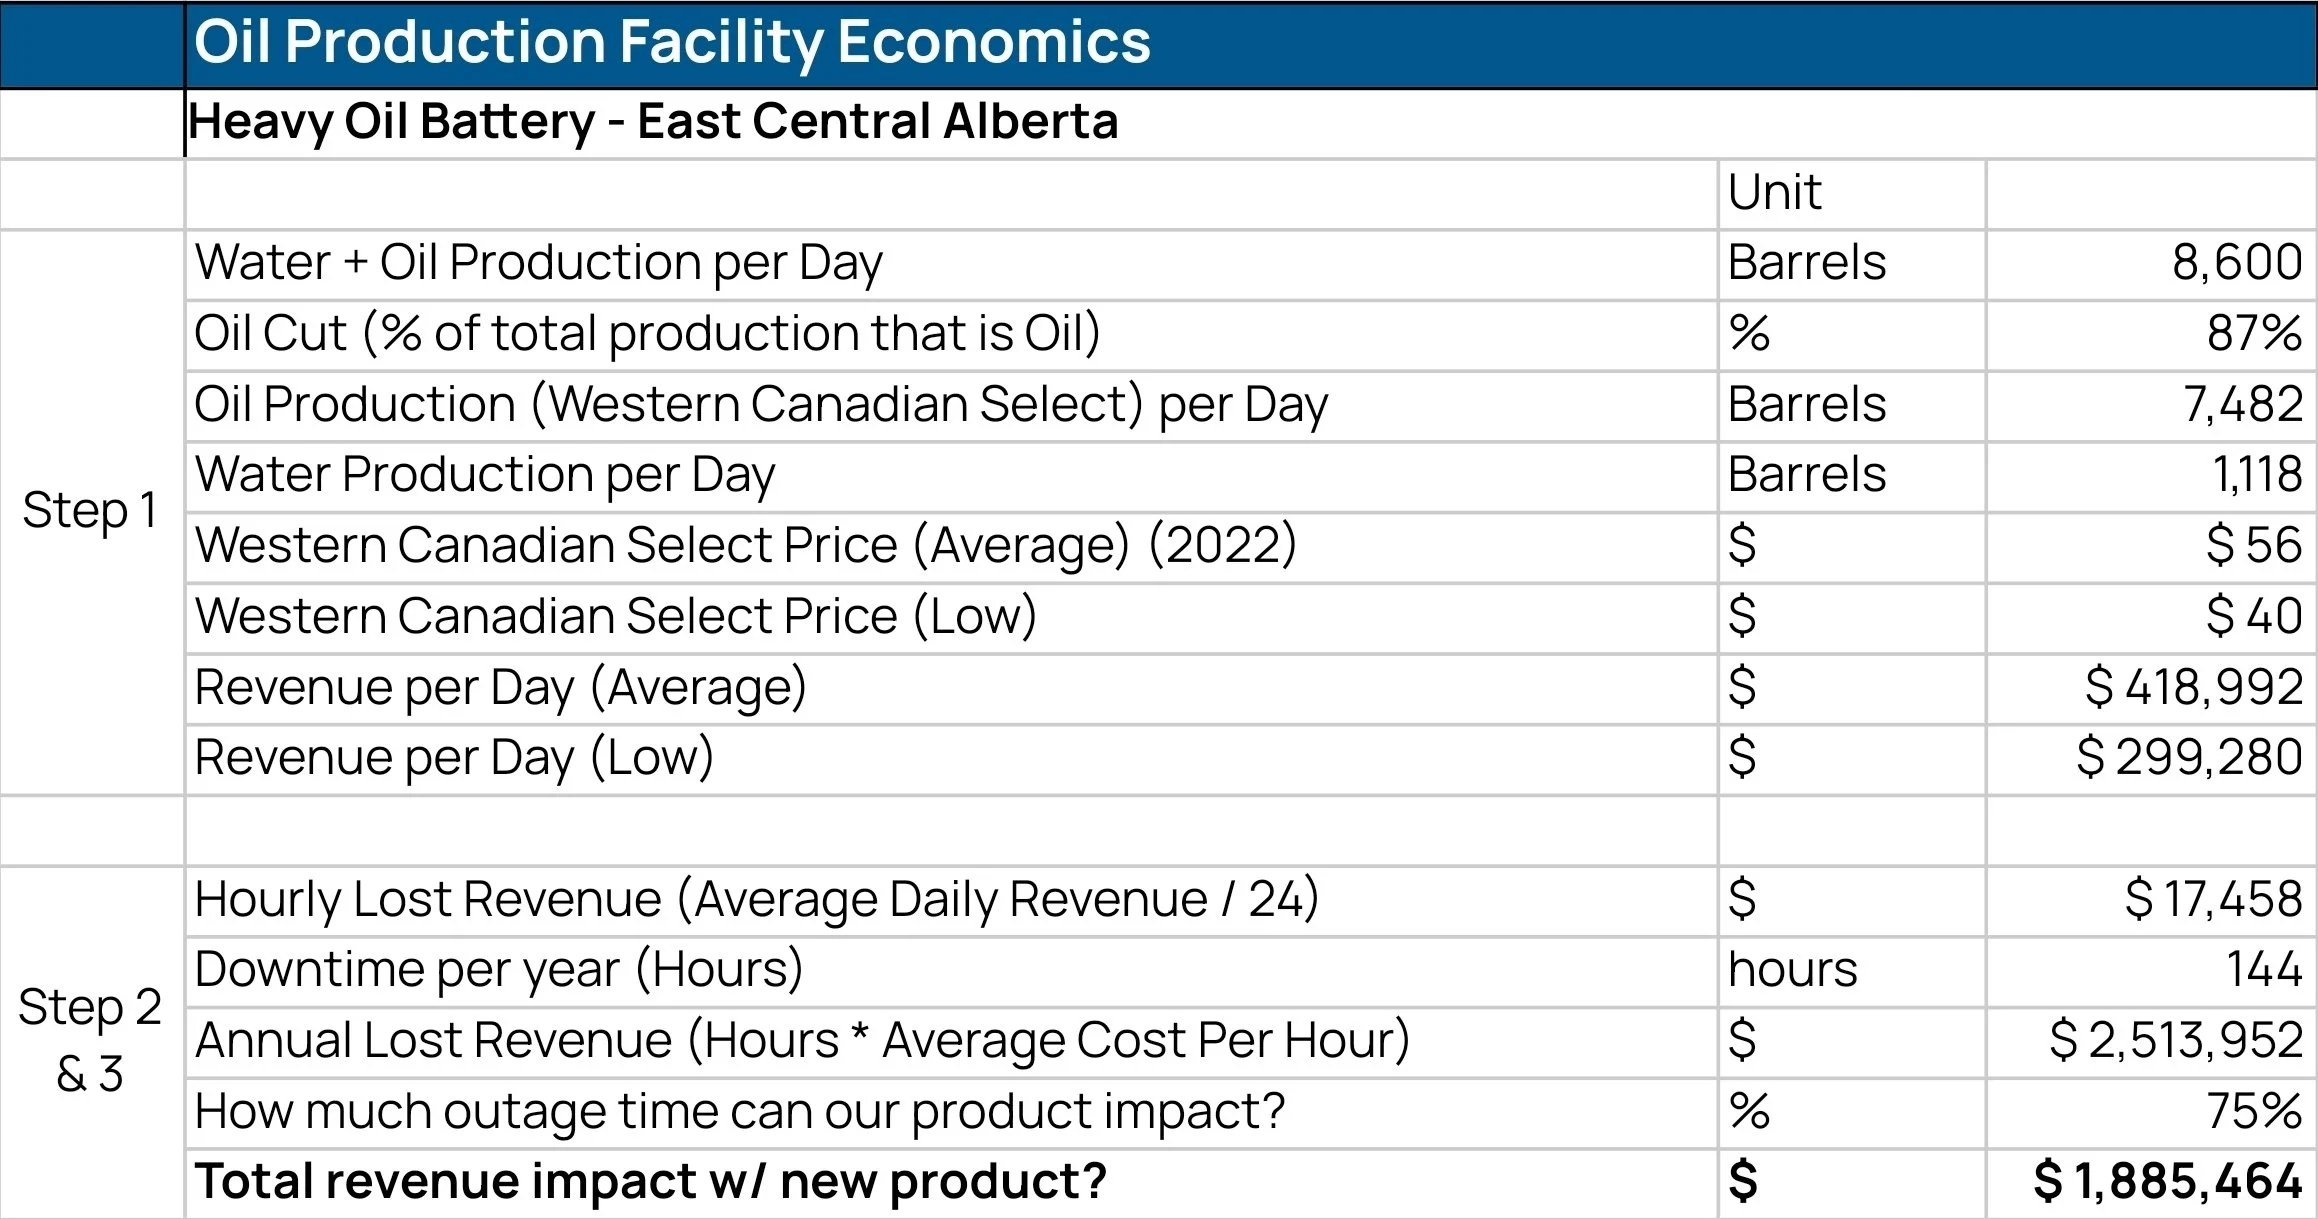
We’ve learned that the opportunity is actually larger than we expected, and have a better understanding of materiality of the problem. Our clients are now looking at additional annual revenue of 1-2% if our tech can do what we think it can.
Step 4: Can I make money? (Bottom-Up Model)
Now that we’ve got assumptions we believe are good, and there appears to be a material amount of value to be created, we can do some rough estimation of how much of the value that’s created we can capture.
In the absence of any comparables my starting assumption is that a customer would be willing to pay 10-20% of the value we create for the opportunity to have the other 80-90% in their pocket. I like 10% as a starting point, because if we can deliver value for 10% of the upside, we deliver a 10X ROI for the customer.
Use this assumption to set your pricing range, and compare your estimated costs to deliver the product or service to your client. Can you make a margin that makes sense in this best case? What if it costs you 2X or 5 X more than you thought? Can we assign a likelihood of each?
Let’s look at how this plays out in my example:
Oil Production Facility Economics
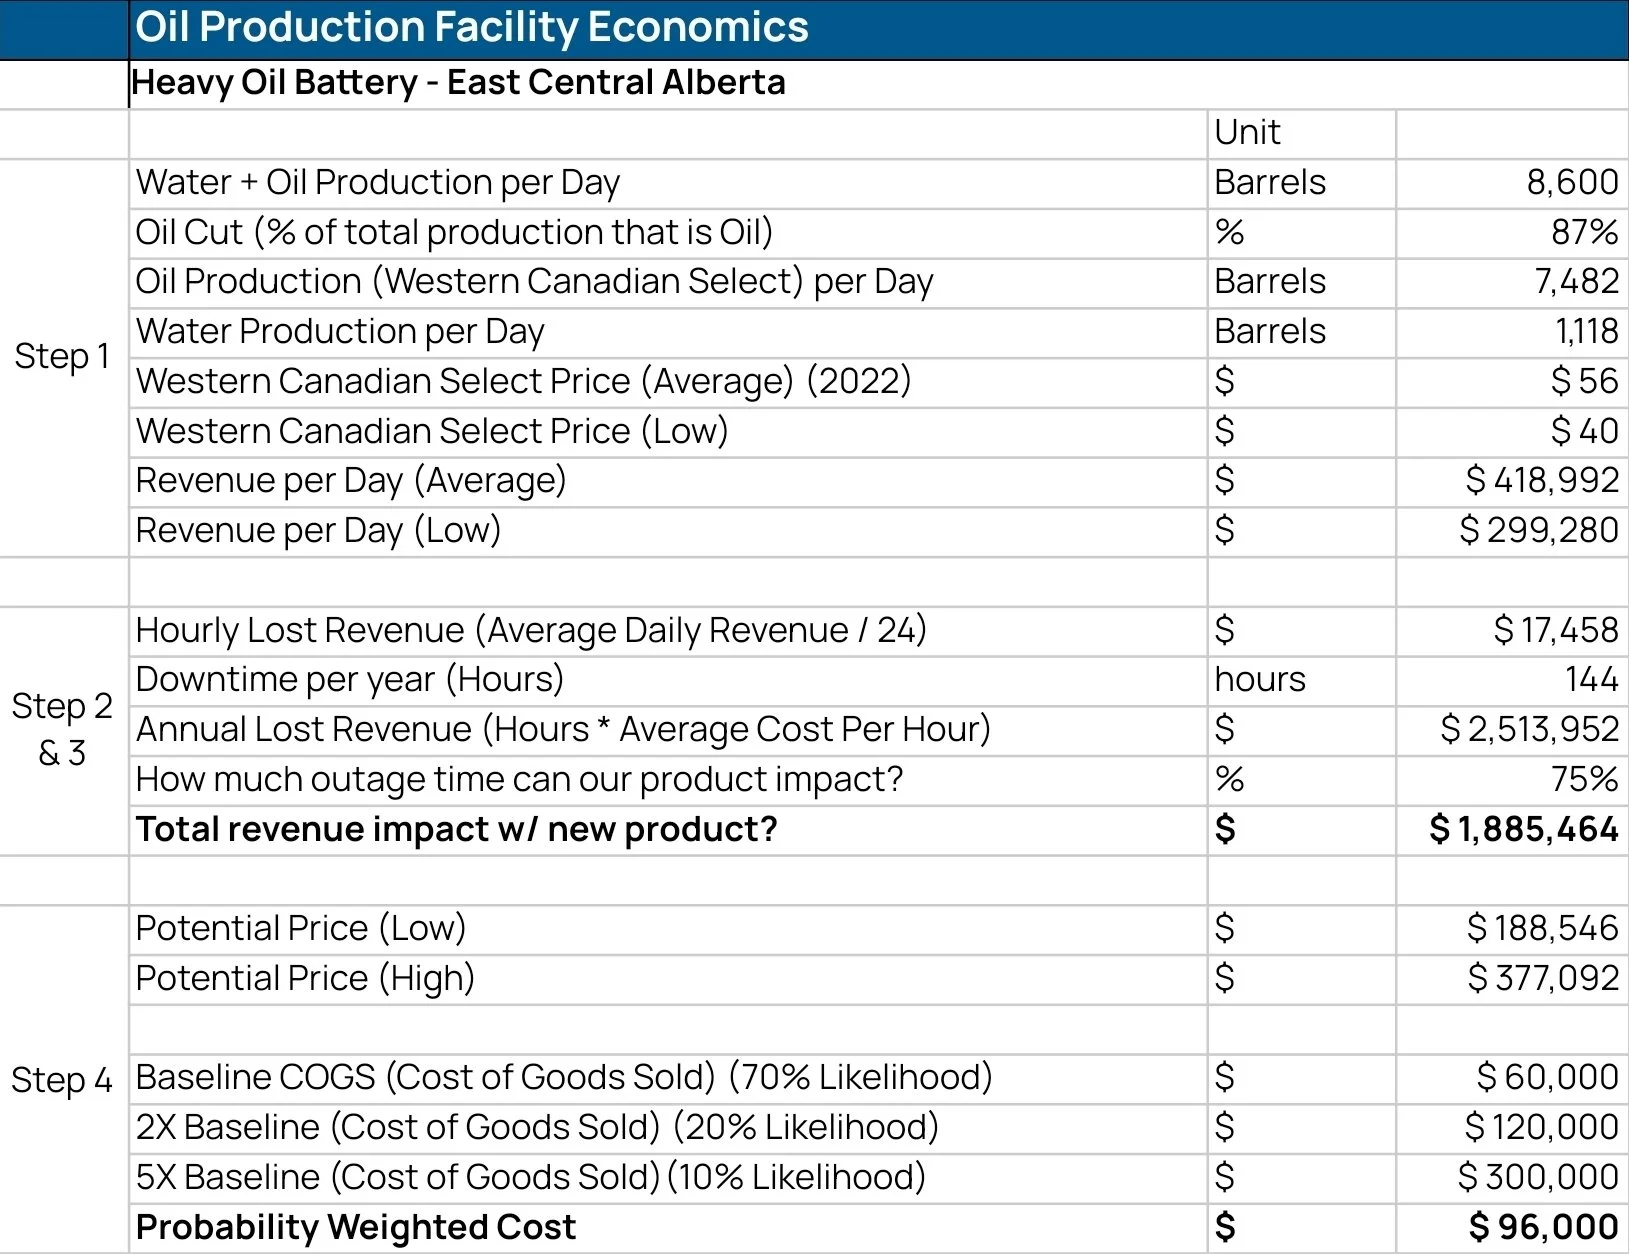
Our worst case scenario makes it impossible to deliver the solution and make any money doing it, but it’s not our most likely outcome. The most likely case has us making 50-75% Gross Margin, with headroom for SG&A which isn’t something we’ve thought about yet. As we continue to develop the business case and validate our assumptions, we need to continue to ensure good margins are possible.
Step 5: What about scale? (Top-Down Model)
Unit economics are great, but deep tech is hard. You need to zoom out and look at the absolute ceiling. What does it look like if you solve 100% of this problem across the entire industry?
Market Size Math (TAM): How many of these facilities exist globally? If there are 5,000 similar facilities, and the average facility is losing $1.9M to this specific problem, the industry is bleeding $9.5 Billion a year.
If your Total Addressable Market (TAM) at 100% penetration is massive, the "juice is worth the squeeze." But if you run this top-down math and realize the entire global market is only worth $20 Million, it likely doesn’t justify the massive capital required to build a hard-tech company.
Step 6: Iterate!
Now that you have your back-of-the-napkin model, your goal is to break it.
Ask yourself the hard questions:
What must be true? Do we need a 99% accuracy rate for the customer to trust us?
Time-to-Implementation: How long will it take to build this? Time is risk. If it takes 5 years of R&D to get a working prototype, the eventual payoff must be much larger to justify the investment over a 1 year validation period.
What is the fatal flaw? Your job isn't to predict the future perfectly; it's to find the riskiest assumption where the whole idea is hanging in the balance. Go test that assumption today.
The Back-of-the-Napkin Worksheet
Use this worksheet to actively hunt for fatal flaws. You are looking for a reason to kill the idea early so you can either fix the fundamental risks immediately, or move on to a better idea.
Value & Pricing
The Specific Value Lever (e.g., uptime, yield): ___________________
Total Value Created for Customer: $________
Price (10-20% of Value Created): $________
Dealbreaker Check: Is the value created massive enough that capturing 10-20% still builds a real business? [ Y / N ]
Unit Economics
Estimated Cost to Deliver (COGS/OPEX) per unit: $________
Estimated Price per unit: $________
Dealbreaker Check: Do these numbers leave room for healthy gross margins once commercial? [ Y / N ]
Market & Scale
Total Addressable Market (100% industry penetration): $________
Estimated Time-to-Implementation: ________ years/months
Dealbreaker Check: If the time-to-implementation is long (e.g., deep tech), is the TAM massive enough to justify the capital and risk required? [ Y / N ]
Bottom Line: If we can't model the business on a napkin, we can't make a decision. Don’t worry about how you solve a problem, and find a problem worth solving!
If you want to chat more about how you can use this approach to speed up your decision making process or just work through some ideas, reach out, and I’d be happy to help!
Stuart